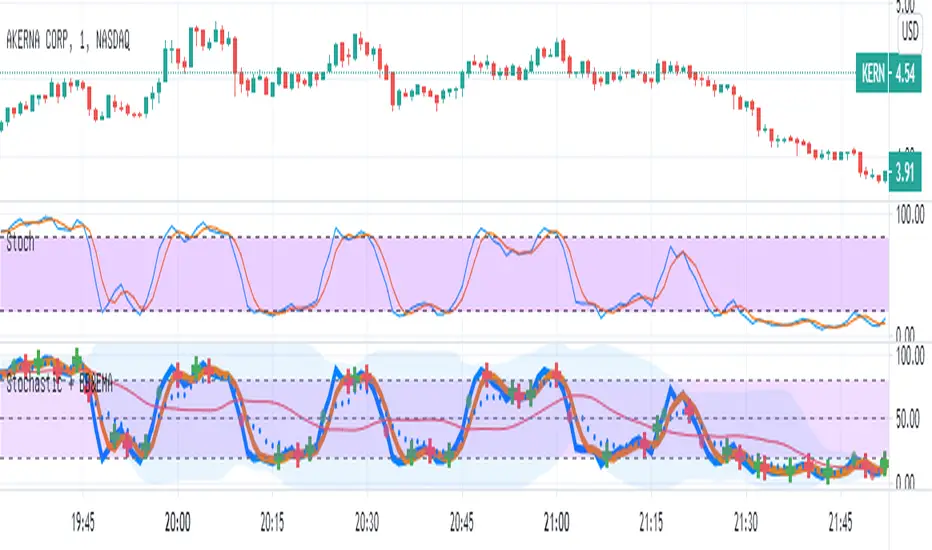
Stochastic with Bollinger & EMAIn this script
I combined the various of the oscillator
Stochastic (STOCH) with BB (Bollinger Bands).
Each cut of K and D creates a mark (+) Red / green - accordingly.
As the Stochastic (K) crosses the BB base, a green / red point is formed accordingly.
As a sign it is possible to continue up / down.
I added EMA8 to K (style circles)
When the oscillator is above the EMA - it is possible that this is a clear sign of an increase.
Band 50 was also added to facilitate the calculations.
Search in scripts for "Up down"
MFI & EMA & Bollinger BandsIn this script
I combined the various of the oscillator
MFI ( Money Flow Index ) with BB ( Bollinger Bands ).
As the MFI crosses the BB base, a green / red point is formed accordingly.
As a sign it is possible to continue up / down.
I added EMA8 to MFI (style circles)
When the oscillator is above the EMA - it is possible that this is a clear sign of an increase.
Band 50 was also added to facilitate the calculations.

Double Zig Zag with HHLLHello Traders,
Here Double Zig Zag with HHLL script is with you. it calculates 2 Zig Zag simultaneously and draws them, and also it calculates and puts Higher High, Lower Low, Higher Low, Lower High labels. All these are done dynamically, it means last HH/HL/LL/LH can change. if price continues to go up then HL can turn to LL or if price continues to go down then LH can turn to HH. This script can be used for different purposes such trend analysis, support/resistance levels, breakouts etc.
I tried to make many things optional:
You can set Periods for Zig Zags as you wish
You can set different colors for both Zig Zag Up/Down lines
You have option to show both Zig Zag, one of them or none them
You have option to show both HHLL, one of them or none them
You can set Zig Zag 1 line style as Dashed or Dotted
You can set Line Widths for Zig Zags
Some examples:
Enjoy!

Reversal Algo (Zeiierman)█ Overview
Reversal Algo (Zeiierman) is an adaptive reversal and momentum detection system that helps identify hidden turning points, pressure zones, and changes in market direction. It brings together advanced modeling techniques such as dynamic volatility bands, adaptive trend tracking, and momentum-based confirmation signals into one clear, visual framework.
Unlike traditional reversal indicators that depend on static oscillators or fixed levels, this tool adapts in real time to market movement. It tracks volatility and directional flow to reveal when momentum is building, slowing down, or preparing to reverse.
Whether applied to short-term scalping, swing positioning, or macro structural validation, this tool provides an adaptive analytical environment that translates complex price dynamics into actionable context.
⚪ Why This One Is Unique
This version of Reversal Algo employs multi-domain adaptive modeling, combining envelope projection, trend inertia estimation, and contrarian equilibrium tracking within a single structure.
Its framework merges nonlinear smoothing manifolds with volatility-compensated directional phase mapping, allowing it to evolve with shifting market states rather than react to them.
Optional AI-driven optimizations enhance precision in unstable regimes by dynamically reshaping envelopes and tracking lines around localized flow curvature.
█ Main Features
⚪ Reversal Cloud
The Reversal Cloud highlights areas of potential expansion, compression, and turning points in price. It adapts to volatility by expanding when markets become unstable and tightening during periods of calm, creating a visual map of market rhythm and elasticity.
When the Cloud widens, it often signals exhaustion or increased turbulence; when it narrows, it suggests balance or an upcoming breakout.
With AI mode enabled, the Cloud automatically fine-tunes its shape to align with live price behavior, keeping its structure responsive and accurate.
⚪ Reversal Signals
Reversal Signals are designed to identify potential market turning points with precision. They combine multiple layers of price behavior—momentum shifts, directional changes, and balance-point deviations—to highlight areas where reversals are statistically more likely. To reduce false clusters, the system intelligently filters out repeated signals within a short time window.
⚪ Reversal/Exit Points
Reversal/Exit Points appear as small, color-coded dots above or below candles. They signal moments where price momentum slows or where the system detects a potential shift in directional strength. These markers are often found near short-term highs or lows, making them ideal for identifying profit-taking zones, re-entry setups, or early warnings of a possible reversal.
⚪ Trend Framework
The Trend Framework provides a clean visualization of the market’s prevailing direction. It smooths out short-term noise to reveal the core trend structure, showing when the market is expanding, contracting, or transitioning between phases.
This framework helps traders quickly see whether price action supports continuation or if the trend is weakening.
⚪ Trend Tracker Line
The Trend Tracker Line is a highly responsive trend detector that reacts quickly to shifts in momentum. It adapts dynamically to volatility, providing an accurate real-time view of directional acceleration and deceleration. This helps traders spot early changes in market tone and evaluate whether a move has the strength to continue.
When AI mode is enabled, the line automatically adjusts its sensitivity to remain stable and consistent across different market conditions.
⚪ Contrarian Bar Coloring
Contrarian Candle Coloring enhances chart readability by visually distinguishing strength from weakness. Green bars highlight areas of building upward momentum, while red bars point to potential pressure or exhaustion. The system continuously adapts its color transitions to reflect subtle momentum shifts, making it easier to recognize when the market is gaining or losing conviction.
An optional AI mode fine-tunes these transitions to match the current market rhythm, ensuring that candle coloration always reflects the underlying flow of strength and weakness.
█ How to Use
⚪ Reversal Trading
The primary purpose of the indicator is to identify reversal opportunities in the market. Reversal or contrarian trading means entering positions against the current directional move in anticipation of a fade or trend rotation. This approach often occurs in high-volatility environments, so it is important to widen your stops, reduce your initial position size, and, if appropriate, scale or average into positions carefully rather than committing all capital at once.
The Reversal Algo provides predefined Buy and Sell signals designed to highlight potential market peaks and troughs. While these signals are highly accurate, they are not meant to call every top or bottom perfectly. In a strong trending market, several reversal signals may appear consecutively before the market fully turns.
⚪ Reversal Signal + Candle Coloring
Combine Reversal Signals with Contrarian Candle Coloring for added confirmation. A practical approach is to wait for a Reversal Signal and then look for a color shift in the candles (for example, from contrarian-colored to standard candles). This color transition acts as confirmation that the active move may be losing strength and that a reversal could be underway.
⚪ Reversal Signals + Reversal Cloud
Consider taking reversal entries only when price interacts with the Reversal Cloud boundaries. The Cloud’s upper and lower layers act as dynamic resistance and support zones. When a Reversal Signal appears near or immediately after price rejection from one of these layers, it adds structural confirmation to the setup and strengthens the case for entry.
⚪ Reversal Signals + Key Levels
One of the most effective ways to trade Reversal Signals is by combining them with key price levels, such as the previous day’s high, low, or close. If price rejects one of these levels while a Reversal Signal prints simultaneously, the confluence of the two events serves as strong validation for a potential turning point.
⚪ Take Profit
The Reversal/Exit Points can function both as entry confirmations and as take-profit zones. If a Reversal Signal was missed but a new Reversal/Exit Point appears near a peak or trough, it can indicate a late-entry opportunity aligned with exhaustion behavior.
These dots are most powerful as profit-taking signals. Since they form near local highs and lows, they often mark regions of temporary imbalance where reversals are likely. When a Reversal/Exit Point forms in the opposite direction of your current position, consider taking partial profits or tightening stops to lock in gains while maintaining participation in the broader move.
█ How It Works
⚪ Reversal Cloud Engine
The Reversal Cloud defines the dynamic upper and lower boundaries of market elasticity by transforming recent price displacements into a smooth volatility field. Through multi-layered envelope modeling, it constructs a continuous topology of expansion and compression zones, revealing where directional energy accumulates or dissipates.
Calculation: Uses layered volatility envelopes that adapt to changing market speed and expansion. A built-in alignment mechanism keeps the upper and lower bands synchronized, while optional AI optimization adjusts the symmetry of the cloud based on short-term directional bias.
⚪ Trend Tracker System
The Trend Tracker isolates directional persistence by modeling angular displacement of price flow over adaptive temporal curvature. It interprets slope evolution as a continuously evolving directional vector field, capturing both acceleration and deceleration within the active regime.
Calculation: Applies adaptive slope modeling to estimate the dominant direction of price flow. The system smooths fluctuations dynamically while maintaining responsiveness to significant shifts in trend velocity. When AI mode is active, an intelligent weighting adjustment refines the tracker’s equilibrium bias for better phase synchronization.
⚪ Trend
The Trend module projects a dual-polarity directional lattice, distinguishing constructive (positive) and distributive (negative) flow environments. It defines equilibrium corridors that expand and contract with evolving trend geometry, offering visual feedback on regime strength and transition probability.
Calculation: Uses weighted directional regression to estimate upper, middle, and lower trend layers. Each structure is color-coded based on price slope and relative position, creating a continuous and easy-to-read trend map.
⚪ Contrarian Bar Coloring Engine
Contrarian bar coloring converts raw bar data into a slope-weighted momentum matrix, visually encoding thrust versus decay phases in real time. It acts as a microstructural interpreter of price inertia, identifying acceleration clusters and momentum fatigue through color transitions.
Calculation: Combines slope analysis and volatility normalization to evaluate how strong or weak each price bar is relative to its trend. The results are reflected in real-time color changes that emphasize momentum strength and fatigue.
⚪ Reversal/Exit System
Reversal and Exit Points are derived from an evolving volatility-based trail that tracks directional exhaustion and reversion potential. These markers visualize transitions in directional energy—helping traders anticipate trend slowdowns or reversal probabilities.
Calculation: Constructs an adaptive volatility trail that contracts as directional momentum weakens. A state-aware detection model identifies inflection points where pressure changes polarity, producing the plotted up/down dots that mark possible reversals or exits. This ensures that each signal dynamically reflects real-time shifts in market energy rather than static thresholds.
⚪ Reversal Signals Core
The Reversal System’s entry framework is designed for precision. It combines several layers of short-term momentum analysis into clear, directionally aligned signals. By balancing different market speeds and measuring how far the price moves from its equilibrium, it identifies high-probability areas where trends may continue or reverse.
Calculation: Implements a composite synchronization framework that aligns short-term momentum phases with equilibrium drift and directional bias. Redundant triggers are filtered out through temporal separation logic, ensuring only the most distinct and reliable signals are displayed. Adaptive thresholds adjust automatically based on volatility and trading mode, maintaining signal consistency across scalp, intraday, and swing environments.
⚪ AI-Adaptive Optimization Layer
The AI layer refines selected modules — Reversal Cloud, Trend Tracker, and Contrarian Candles — by continuously recalibrating their internal weighting curves according to volatility structure and price curvature. It acts as an intelligent stabilizer that adjusts smoothing depth, boundary stiffness, and gradient bias dynamically.
Calculation: Utilizes a Context-Aware Kernel Adjustment Engine, estimating curvature variance and phase imbalance to auto-tune envelope response. The model performs iterative self-alignment to preserve directional fidelity under rapidly changing flow dynamics.
-----------------
Disclaimer
The content provided in my scripts, indicators, ideas, algorithms, and systems is for educational and informational purposes only. It does not constitute financial advice, investment recommendations, or a solicitation to buy or sell any financial instruments. I will not accept liability for any loss or damage, including without limitation any loss of profit, which may arise directly or indirectly from the use of or reliance on such information.
All investments involve risk, and the past performance of a security, industry, sector, market, financial product, trading strategy, backtest, or individual's trading does not guarantee future results or returns. Investors are fully responsible for any investment decisions they make. Such decisions should be based solely on an evaluation of their financial circumstances, investment objectives, risk tolerance, and liquidity needs.
Paid script

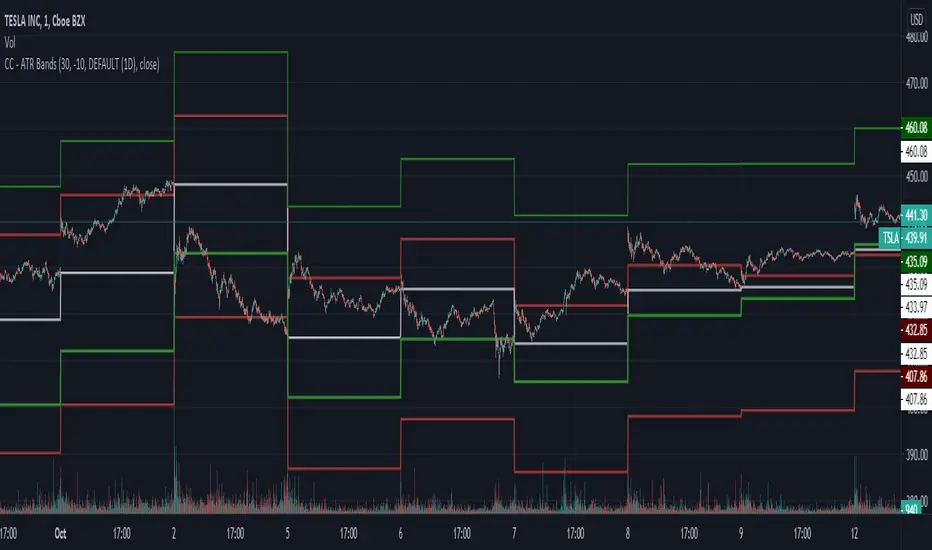
CC - ATR BandsPlots ATR bands around candles at any HTF resolution you desire, taken in through the inputs. The white line represents the open of the HTF, the red and green the expected boundaries. You can use the risk tolerance slider up/down to adjust how risky you want to be with the ATR bands.
I am not responsible for outcomes using this method, indicator or anything else. Please do your own due diligence.
Scanner Sauce Helper by MrTuanDoanThis is a helper indicator for Scanner Sauce strategy by Manny Q.
Best use with Harmonic patterns .
v0.2 features
Show BUY/SELL signals (green/red background)
Draw Scanner Sauce template
Alerts for BUY/SELL/BUY OR SELL
Alerts for MG4 and MG20 crossing
Orange background confirms the current trend.
How to use signals
Green background for BUY
Red background for SELL
Best use with Support and Resistance
Go for SELL if the last touch was upper band
Go for BUY if the last touch was lower band
Plus: analyze on higher timeframe to confirm the signal.
For BUY/SELL signal , if the green line just crossed up/down the purple line, it's a strong signal for 2nd entry.
Please always follow your risk management.
PM us to obtain accesss

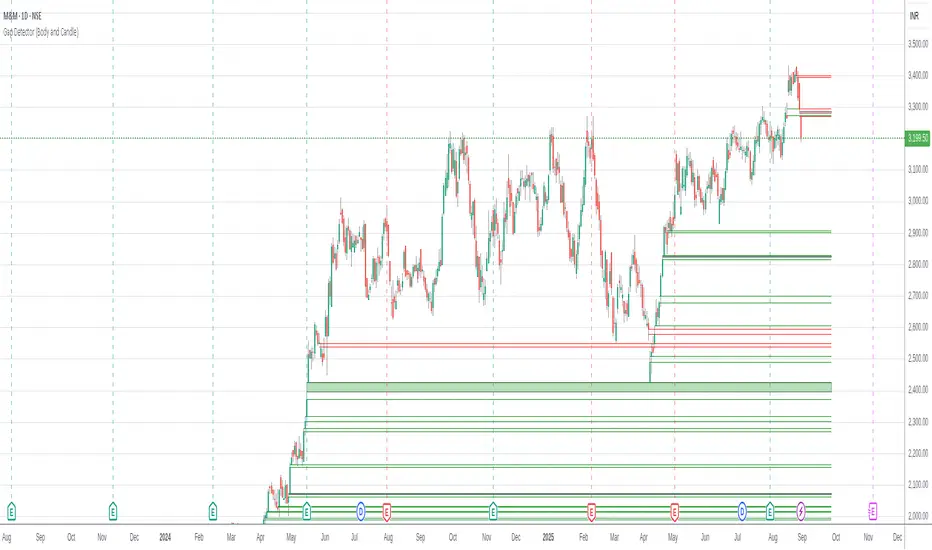
Body Gap Detector
This script was inherited from "GAP DETECTOR" by Asch- and the modified version is being published with consent of the author.
This script identifies gap up or gap down between candle bodies (for the selected time frame). The original script has been reworked to consider Open/Close instead of the High/Low. It identifies "Gap" up/down and indicates them with markers drawn from "Open/Close" of one candle to the "Close/Open" of another.
The default setting is to consider the last 1500 candles. "Gap Up" is indicated by Green bars and "Gap Down" is indicated with Red bars.
Supertrend, MA & Market Strength by Keiron RichieThis script comprises of three separate indicators to give an improved view; a redesign of the Supertrend indicator to identify up/down trend and changes the background colour to red or green accordingly. This is then overlayed with the Mother of Adaptive Moving averages by John Ehlers (MAMA) which adapts to price movement in an entirely new and unique way. The advantage of this method of adaptation is that it features a fast attack average and a slow decay average so that composite average rapidly ratchets behind price changes and holds the average value until the next ratchet occurs. Since the average fallback is slow I can build trading systems that are virtually free of whipsaw trades.
Additionally, there are up & down arrows below and above the bars respectively which demonstrate overall market strength or weakness. By combining the relative strength in a trend with the true strength of the Nasdaq (NDX) and S&P500 (SPY) we can then compare that against the volatility/fear index (VIX) to show if the market is excerpting pressure on the component in either direction. i.e. if the red arrow shows then the market indexes true strength is decreasing & if the small green arrow shows then the market index is gaining strength which may be likely to impact the component/symbol you are viewing. It’s a very quick and effective method of seeing the strength within the market indexes and how they are effecting your chart.
Because of the nature of the script it is tested and works well on all timeframes with Stocks listed on NASDAQ & S&P500.
Alerts are available for a change of background colour state. i.e Green=Buy, Red=Sell

HMA Signal with Targets and StopThis is an update to a previous script. (Hull Signal with Auto Fib)
I removed any reference to the fib sequence.
The code uses a 40 HULL MA on the 30 second chart to identify up/down changes in trend. It ensures the equity is positive on the day to go long, or negative on the day to go short.
It draws the stop and target lines according to the current 3 min ATR over the last 4 periods (12 minutes) : x1 x2 x3 x4 x6
Candles are highlighted upon entries. Grid begins.
Code resets upon one of the following:
- 4x target achieved and the trade has been active for 30 minutes
- 6x target achieved
- Stop hits
- 30 minutes have lapsed and the close is less than target x2
I have performed simple strategy analyses and have determined:
(Approximately)
34% lose x1
66% achieve 1:1, manually stop out at B/E after first target hits
48% achieve 2:1, manually stop out above B/E after x2 target hits
38% achieve 3:1, manually stop out above x1 after x3 target hits (will reset fib grid without change in trend)
13% achieve 4:1, manually stop out above x3 after x4 target hits (will reset fib grid without change in trend)
I have not evaluated for x6 though it expected to be around 5% of the winning trades. (will reset fib grid without change in trend)
Message me if your interested further.

Fibs, Pivots & SupportA 3-in-1 indicator for displaying Fibonacci retracement and pivot levels over custom periods along with areas of previous major support. Each of the three tools can be toggled on/off.
Used properly, these should give you a better idea of where to place orders and take profit.
Alerts are built in but had to remain somewhat generic due to data point limitations. There are alerts for crossing and crossing up/down over each category of line.

One-Stop Trading SetupOne-Stop Trading Setup:
This script designed to identify up, down, and sideways trends. 200 HMA, 9 EMA, PSAR, and ATR are used to identify the strength of any instrument.
Candle Colors - Simpler approach to follow:
Green color indicates for up side trade signals
Red color indicates for down side trade signals
Yellow color can be interpreted for stop, sideways, and counter trade trade signals
Multiple Trade Setups:
Green Zone - Trading green candles within green zone has better odds of long trades
Red Zone - Trading red candles within red zone has better odds of short trades
200 HMA - Candles above 200 HMA mostly for long trades. Candles below 200 HMA usually for short trades. But the zone also very important to consider
9 EMA - Cross over above 200 HMA in Green zone, look for long trades. Cross over below 200 HMA in red zone, look for short trades
PSAR - This can be used as potential initial warning sign. Also can be used to exit partial or wait for it goes to opposite side for taking trade decisions
Candle Above all - If Green candle and above all the indicators, then very good sign of long side. If red candle and below all indicators, then very good sign of short side.
Multiple Time Frame:
This works very well with any instrument and on any time frame. Always its better to do analysis on multi time frame before entry, exit, and trade execution. Back test it with this setup and also observe it on live market. That will give edge in taking trade decisions. All the best and happy trading.
Disclaimer:
This script and setup is written with the sole purpose of identifying the strength of any instrument. Interpretation, trade decisions, and changing inputs are up to each individual users/trades.
Trend Lines Pro for IndicatorsHello Traders!
We need to make things better & better to solve the puzzle and I try to do my best on this way. now I am here with my new Trend Lines Pro for Indicators script.
As you know, Trend Lines is very subjective and many people (even professionals) draw different Trend Lines on the same chart. This is confusing and there must be an automation to make the life easer. with this tool I tried to automate it.
The idea in this script is different from my previous trend lines scripts. In this, I use channel idea so it can check number of pivot points it contains. it also checks the angle while choosing trend lines. then we get stronger and useful Trend Lines automatically.
There are some option in the script, let see one by one:
Indicator: the indicator on which you want to see Trend lines, Predefined Indicators are: RSI, CCI(Commodity Channel Index), OBV(On-Balance Volume), Momentum, MACD, CMF(Chaikin Money Flow), External Indicator
External Indicator: with this option you can use other indicators as input and get trend lines for them.
- First add an indicator (such as MFI)
- in "Indicator" option select "External Indicator"
- click "External Indicator" option
- and choose the indicator from the list
Pivot Period: The Length to calculate Pivot Highs/Lows
Threshold Rate: This rate is used for channel width. it you give bigger numbers then you get bigger channels. it's 4 by default
Minimum Angle Rate for new Trendline: if there are different trend lines , there must be an angle between them to choose best trend lines . you can set the angle with this option.
Minimum Strength: there can be many trend lines but we need to choose/use stronger ones. with this option you can set the number of pivot points a trend channel have to contains. default value is 2
Maximum Loopback Length : by default the script can check 40 pivot highs and 40 pivot lows but to make the script faster and useful I needed to add a limitation for the number of bars that the script can go back.
Show Trendlines as: you can see trend lines as "Trendline", "Channel", "Trend Channel". you can see examples below.
Enable Weak Trend Lines : if there is no trend lines strong enough (as defined in "Minimum Strength" option) you have option to see a weak trend line . that is useful sometimes. if you enable this option weak lines are shown as dotted lines.
Show Price Labels on Trendlines: the script can show the price levels to break trend lines . the example
Line Style: trend lines can be Solid or Dashed as you wish
Color theme: colors of the Up/Down Trend lines can be set. Red, Lime, Blue, White, Black, Olive, Gray
Indicator color: colors of the Up/Down Trend lines can be set. Red, Lime, Blue, White, Black, Olive, Gray and Yellow
and last options are for length options for RSI, CCI, Momentum, MACD, CMF
There are many alerts such: Support/Resistance Broken, Price in Support/Resistance channel, Support/Resistance line broken but still in a channel that means it broke S/R but there is another trend lines to break.
Below an example how the script uses external indicator as input and draws trend lines on it. in this example chaikin ossilator was added to the chart and get trend lines for it. (I am going to make a short video about it)
An example of Trend Channel is below. when you use trend channel option you can get "big picture" of whats going on
An example for trend lines in channels, that is the idea behind this trend lines script
An axample for trend lines for CCI:
Trend lines on OBV:
Trend lines on Momentum:
Trend lines on MACD:
Trend lines on CMF:
Different colors and line styles:
Please send me message for access and do not hesitate to ask your questions about this tool.
Enjoy!
DISCLAIMER: No sharing, copying, reselling, modifying, or any other forms of use are authorized for our documents, script / strategy, and the information published with them. This informational planning script / strategy is strictly for individual use and educational purposes only. This is not financial or investment advice. Investments are always made at your own risk and are based on your personal judgement. I am not responsible for any losses you may incur. Please invest wisely.
Paid script

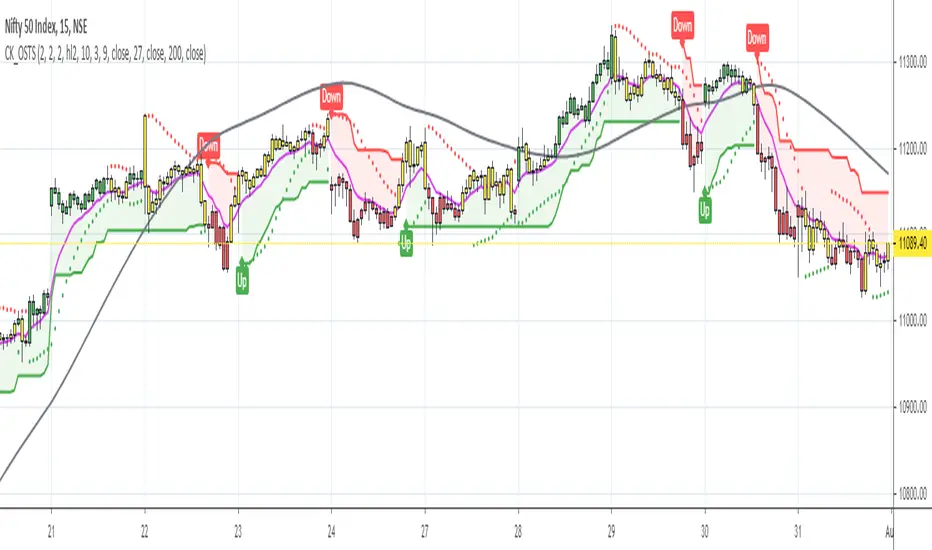
Trend Up\DownThis indicator is used to visually determine the trend on a chart, signaling a likely change of Up or Down trend.
The indicator can also signal that the asset is likely to be oversold by signaling the emerging triangle from below.
It is recommended to be used in conjunction with the graphical technical analysis and at oversold is well read with bollinger bands .
To gain access to this indicator, you may contact me via direct message on Tradingview or Telegram.

Trend Lines ProHello Traders!
We need to make things better & better to solve the puzzle and I try to do my best on this way. now I am here with my new Trend Lines Pro script.
As you know, Trend Lines is very subjective and many people (even professionals) draw different Trend Lines on the same chart. This is confusing and there must be an automation to make the life easer. with this tool I tried to automate it.
The idea in this script is different from my previous trend lines scripts. In this, I use channel idea so it can check number of pivot points it contains, it checks H/L/C in the channels as well. it also checks the angle while choosing trend lines. then we get stronger and useful Trend Lines automatically.
There are some option in the script, let see one by one:
Pivot Period: The Length to calculate Pivot Highs/Lows
Source : Option to use "High/Low" or "Close" as the source for Pivot Points
Threshold Rate : This rate is used for channel width. it you give bigger numbers then you get bigger channels. it's 4 by default
Minimum Angle Rate for new Trendline: if there are different trend lines, there must be an angle between them to choose best trend lines. you can set the angle with this option.
Minimum Strength: there can be many trend lines but we need to choose/use stronger ones. with this option you can set the number of pivot points a trend channel have to contains.
Maximum Loopback Length: by default the script can check 40 pivot highs and 40 pivot lows but to make the script faster and useful I needed to add a limitation for the number of bars that the script can go back.
Show Trendlines as: you can see trend lines as "Trendline", "Channel", "Trend Channel". you can see examples below.
Enable Weak Trend Lines: if there is no trend lines strong enough (as defined in "Minimum Strength" option) you have option to see a weak trend line. that is useful sometimes. if you enable this option weak lines are shown as dotted lines.
Show Price Labels on Trendlines: the script can show the price levels to break trend lines. the examples are below
Line Style: trend lines can be Solid or Dashed as you wish
Color theme: colors of the Up/Down Trend lines can be set. 'Red', Lime, Blue, White, Black, Olive, Gray
you can see the Trend Lines as channels:
you can see Trend Channels to see the big picture.also there is dotted trend line as weak trend line defined above.
you can set color/width of trend lines as you wish.
the script is fast enough to run on 1sec chart:
you can use this script on any chart, fx pairs, stocks, indices etc
I made a short video to explain how to use it and some options:
Please PM for access.
Enjoy!
DISCLAIMER: No sharing, copying, reselling, modifying, or any other forms of use are authorized for our documents, script / strategy, and the information published with them. This informational planning script / strategy is strictly for individual use and educational purposes only. This is not financial or investment advice. Investments are always made at your own risk and are based on your personal judgement. I am not responsible for any losses you may incur. Please invest wisely.
Paid script

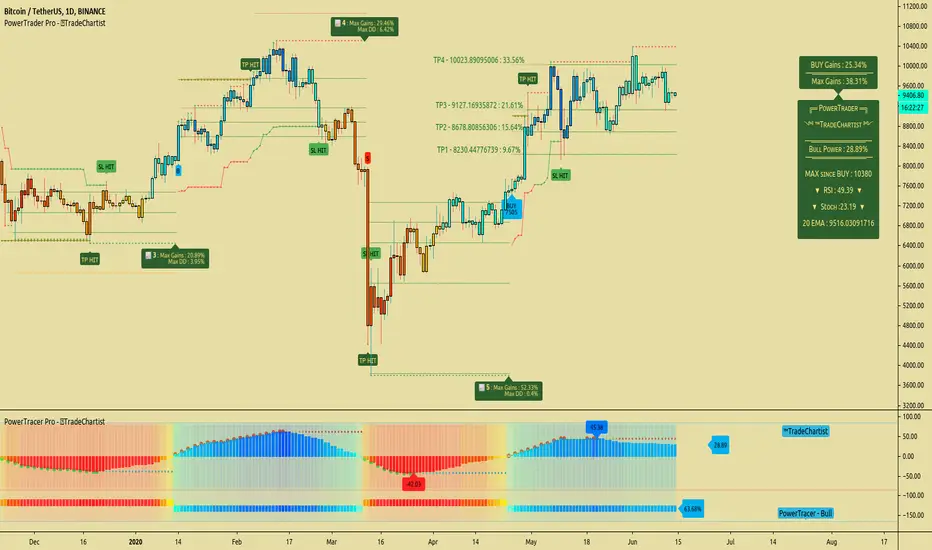
TradeChartist PowerTrader ProTradeChartist PowerTrader Pro is a versatile Signal generator and Signal plotter on the main price chart based on signals from other compatible scripts like TradeChartist PowerTracer Pro . This elegantly designed script plots the following based on user preference.
BUY and SELL signals based on external compatible signal source
Automatic Targets if opted from settings
Trailing or Fixed Stop Loss based on user input
Take Profit % and Quantity to trade based on user input
PowerTrader Dashboard displaying 14 period RSI, Stoch and 20 EMA
Real-Time Gains Tracker displaying Max Gains and open PnL
Past Performance labels displaying Max Gains and Max Drawdown for each trade
Higher Highs since BUY and Lower Lows since SELL
Once the external Signal is connected to the script, the results based on signal backtester ( TradeChartist PowerTracer Pro Backtester ) can be used to optimise the settings to generate plots and also to set Alerts for the following.
Long and Short Signals
Long and Short Stop Loss Hit
Long and Short TP Hit
Move up/down Trailing SL
To create alerts, the user must choose PowerTrader Pro from the alert condition drop-down and choose the required alert. Since the signals are generated only after confirmation, "Once per bar" must be used for Alerts.
===================================================================================================================
This is not a free to use indicator. Get in touch with me (PM me directly if you would like trial access to test the indicator)
Premium Scripts - Trial access and Information
Trial access offered on all Premium scripts.
PM me directly to request trial access to the scripts or for more information.
===================================================================================================================
Wave Trend MTF웨이브트렌드의 멀티타임프레임 지표입니다.
더 큰 프레임에서의 움직임을 확인하여 낮은 프레임에서 대응이 가능해 집니다.
낮은 프레임에서 상하향 방향을 찾기 어려운 분들께서는 MTF기능으로 상위프레임의 움직임은 어떠한지 미리 파악하실 수 있습니다.
단순한 지표이므로 하나만 보는것이 아니라, 다른 지표들도 같이 참고하심이 좋습니다.
이 지표의 사용을 원하신다면 메세지나 댓글을 남겨주세요~!
Wave Trend is a multi-time frame indicator.
By checking the movement in a larger frame, you can respond in a lower frame.
For those who are unable to find the up-down direction in the low frame, the MTF function allows you to know in advance how the upper frame moves.
Since it is a simple indicator, it is good to refer to other indicators as well.
If you want to use this indicator, please leave a message or comment~!

KINSKI RSI Short/LongExtends the display of the Relative Strength Index (RSI) by shorts and longs from Bitmex and shows them as a diagram.
How to interpret the display?
- blue line is the default Relative Strength Index
- red line means "oversold
- green line "overbought"
- grey dotted line up/down indicates the optimal range for up and down movements 30 to 70
- in general, the reaching or crossing of the thresholds in the direction of the mid-range is seen as a possible buy or sell signal
- RSI values (blue line) of over 70 percent are considered "overbought", values below 30 percent "oversold
Which settings can be made?
- Selection for the "Currency". Default value is "BTCUSD". Currently only the following currencies are supported "BTCUSD", "ETHUSD", "ETCUSD", "OMGUSD", "XLMUSD", "XTZUSD".
- Selection for calculation formula ("Calculation"). The default value is "hlc3".
- Field for the moving average value ("RSI Length"). The default value is 14, but values of 7, 9 or 25 are also common. The shorter the period under consideration, the more volatile the indicator is, but with longer periods, fewer signals are triggered.
- furthermore you can make layout adjustments via the "Style" menu

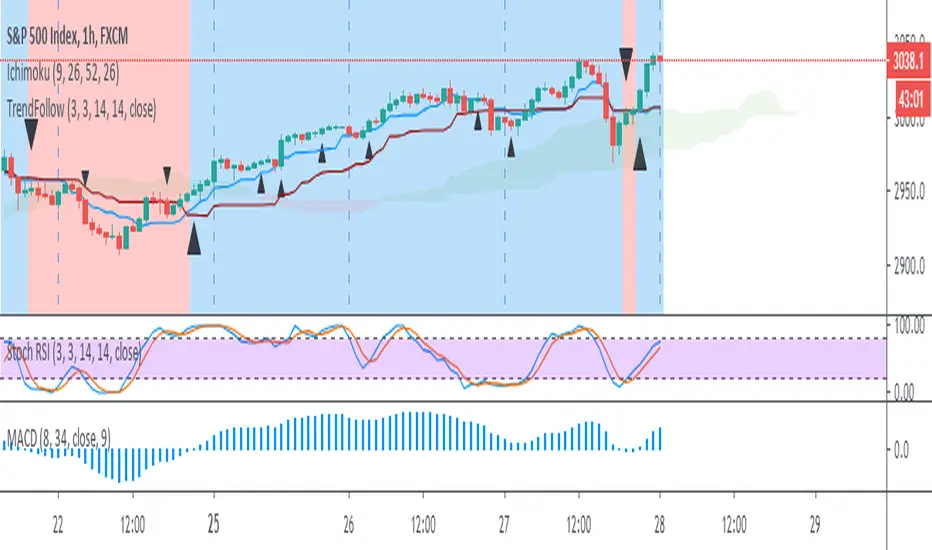
Trend Follow with kijun-sen/tenkan sen for 1 Hour SPX
This script determines, plots and alerts on probable trend initiation and continuation points, using tenkan-sen(conversion line of ichimoku), kijun-sen(baseline of ichimoku) and stochastic RSI, for 1 H SPX.
New long/short trend initiates when prices cross above/below kijun sen. The trend continues when prices cross above/below tenkan-sen or stochastic RSI crosses up/down its signal line, while prices are above/below kijun-sen.
It is good to take partial profit between 10-15 points gain and trail the left with stops below kijun-sen line.
While placing the order, using 2-3 points buffer above/below of signal bars is recommended. Additionally, please be careful about clouds and do not place long/short orders below/above clouds.

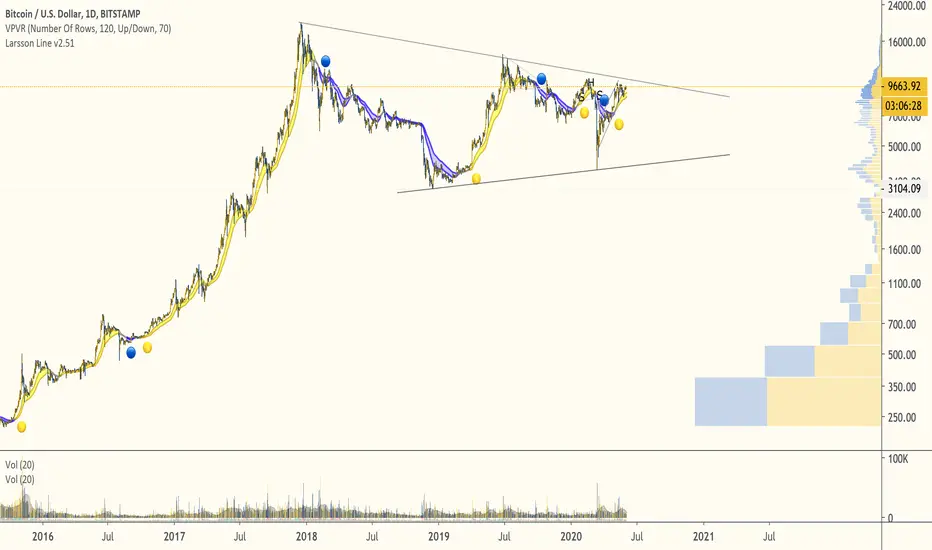
Larsson LineThe Larsson line supports trend trading of tech assets over long timeframes:
- Trend trading (unsuitable for range trading)
- 4h candles to monthly candles (less suitable for hourly candles, unsuitable for high-frequency trading)
- Tech stocks and cryptocurrencies (not designed for commodities)
The indicator can aid traders following a rule based trading system by providing measure of trend consistency that is always in exactly 1 of 3 states - up, down or inconclusive, while masking inner states.
This edition handles more edge cases than the previous indicator and is intended to replace it after a period of live use.
Trend Follow with 8/34 EMA and Stoch RSI for 1 Hour SPX
The script determines and plots entry points for 1 hour S&P index using 8/34 emas and stochastic RSI. When 8 ema above/below 34 ema up/down crosses of stochastic RSI are considered as long/short entries. Entry prices should be above/below high/low of the signal bars accordingly. Ichimoku cloud can be used as extra filtering.
BB Monitor IndicatorThis is a basic volatile indicator based in the Bollinger Bands that show the explosive market moves (up/down).

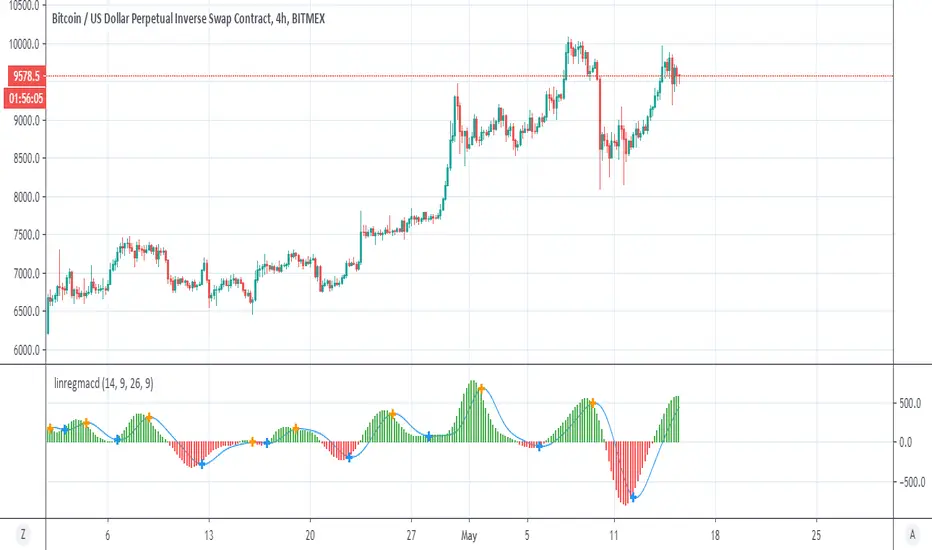
LinearReg macdA hybrid of linear regression and MACD
crossing up or down of macd and signal shown by + either blue=up , down=orange
macd >0 bullish =green
macd<0 bearish =red
setting can be change to optimise it
Price Continuation (The Strat)Shows the historic bar type, whether it is up, down, up and inside, down and inside, up and outside, or down and outside. Will only display historic bar type based on the selected time timeframe. (Ex. if you are looking at the weekly time frame, you will only see the bar type for Year, Quarter, Month, and Week. It will not display the Day or Hour bar type.)
